

Tech News.
Technical Feasibility Study
Biogas Production from Flour Matrix
Feasibility analysis, energy potential, environmental impacts, and process contaminant assessment.
Technological Process
Anaerobic Digestion Infrastructure
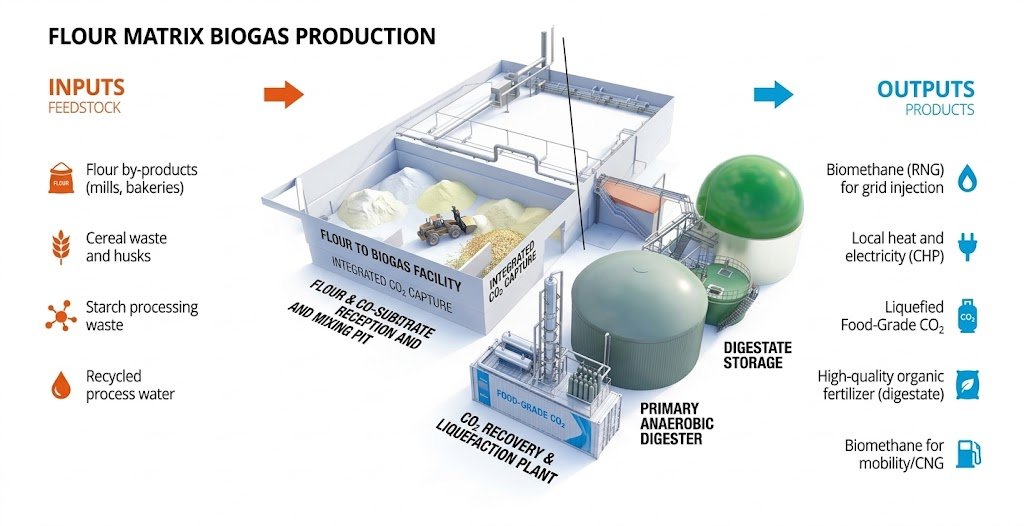
Image Source: www.renergon-biogas.com
Substrate Feeding
Integration of industrial waste, flour, and cereal by-products.
Anaerobic Digester
Sealed reactor with microbial decomposition in the absence of oxygen.
Generation & Digestate
Thermal/electrical energy production and organic fertilizer recovery.
Feedstock Selection
Why Use Flour as a Matrix
High Energy Content
Starch-rich matrix with extremely high methane conversion rates.
Circular Economy
Direct valorization of waste from mills and industrial bakeries.
Carbohydrate Load
Rapid degradation kinetics to maximize yield.
Efficiency & Market Feedstock Cost Analysis
Comparison between Biogas Yield (Sm³/t) and Specific Energy Consumption (€/MWh)
Benchmark 1: Yield (Sm³/t) & Financial Impact (€/t)
Gaseous potential and financial impact per ton (Green = Gate Fee Revenues; Blue/Amber = Purchase Costs).
Benchmark 2: Specific Energy Consumption (€/MWH OF BIOMETHANE)
Pure process energy consumption / operational utility cost per MWh of biomethane produced (independent of feedstock prices).
Kinetic Parameters & Hourly Sizing (Reference base: 10 t/day)
- • Hourly Biogas Flow Rate: ~66.6 Sm³/h (with average yield of 160 Sm³/t).
- • Methane Flow Rate (CH4): ~40 Sm³/h (estimated concentration at 60%).
- • Hydrolysis Kinetics: Rapid conversion of starch into simple sugars; requires strict pH control and VFA/TAC ratio (< 0.3) to prevent acidification inhibition.
- • C/N Ratio: >35:1 in pure flour; optimal yield guaranteed via co-digestion with nitrogen-rich matrices (e.g., livestock manure) to maintain the ideal range (20:1 - 30:1) and supply essential trace elements.
Leaching & Reaction Process
Flour Conversion Stages
Pre-Treatment
Mixing with water and enzymes to increase digestibility.
Biochemical Digestion
Hydrolysis, acidogenesis, acetogenesis, and controlled methanogenesis.
pH Monitoring
Constant control of volatile fatty acids (VFA) to prevent inhibition.
Upgrading & CHP
Energy cogeneration or biomethane grid injection refining.
Financial Sustainability
Revenue Streams and Profitability
Energy Sales
Injection of electricity produced via CHP systems into the grid.
Digestate Commercialization
Sale of the enriched biological residue as an agricultural soil improver.
Gate Fees
Fees collected from industrial partners for waste disposal.
Criticality Matrix
Assessment of Potential Contaminants
Image Source: www.eurekalert.org
Organic Compounds (VOC) & NH3
Release of ethanol, acetic acid, and ammonia from protein fractions.
Pathogens and Mycotoxins
Risk of Salmonella, E. coli, or aflatoxins from improper storage.
Heavy Metals & Residues
Traces of cadmium/lead from milling and antibiotic resistance genes.
Pollutant Compounds Analysis
The main pollutant compounds (sulfur compounds, VOCs, and others) are listed below in decreasing order of typical concentration/relevance for this specific feedstock:
1. Sulfur Compounds (Derived primarily from protein degradation in gluten and cereal residues)
- Hydrogen Sulfide (H2S): By far the predominant sulfur contaminant. Although flour-based substrates are low in sulfur compared to sewage sludge or mixed food waste, the protein fraction (e.g., wheat gluten) generates H2S concentrations in the biogas generally ranging between 100 and 1,000 ppm. It is highly corrosive to CHP engines and toxic.
- Mercaptans (Thiols, e.g., methanethiol and ethanethiol): Present in trace amounts on the order of sub-ppm or a few ppm. They also derive from the degradation of sulfur-containing amino acids (methionine and cysteine) and contribute massively to the odor impact.
- Carbonyl Sulfide (COS) and Dimethyl Sulfide (DMS): Present in extremely small traces (fractions of a ppm), formed through secondary biological or thermal reactions inside the digester.
2. Volatile Organic Compounds (VOCs) and Other Organic Pollutants
- Gas-phase Short-Chain Volatile Fatty Acids (e.g., Acetic Acid / light VFAs): Given the extremely rapid hydrolysis kinetics of flour substrates, if the reactor experiences minor acidification stress, light organic acid vapors can volatilize into the digester's headspace.
- Alcohols (particularly Ethanol and Methanol): Produced by collateral alcoholic fermentations or by yeasts potentially present in bakery waste or flour directed to wet pre-digestion storage.
- Carbonyl Compounds (Trace Aldehydes and Ketones): Derived from intermediate degradation processes of complex carbohydrates and fermentable sugars.
- Volatile Aromatic Hydrocarbons and Siloxanes (extremely marginal): Unlike municipal solid waste (MSW) or sewage sludge, pure industrial flour substrates contain near-zero amounts of siloxanes or heavy hydrocarbons, barring cross-contamination from food waste packaging delivered alongside the flour.
3. Other Non-Sulfur Inorganic Compounds
- Ammonia (NH3): Although not a sulfur compound or a VOC, free gaseous ammonia develops in the biogas due to the nitrogen component (cereal proteins), especially if the reactor operates at high temperatures (thermophilic) or at pH levels skewed toward alkalinity. It can combine with moisture to form corrosive pipelines.
- Water Vapor (saturated H2O): Always present at 100% relative humidity in the digester's headspace, it drastically amplifies the corrosive effect of H2S by forming sulfuric acid (H2SO4).
Process Note
For flour substrates, the primary mitigation plan (Section 07 of the study) must focus primarily on the abatement of H2S (via digester micro-aeration or activated carbon filters) and strict VFA/pH control to limit the anomalous formation of acidic VOCs caused by sudden organic overloads.
Control Plan
Environmental Mitigation Measures
C/N ratio explanation
The C/N ratio (Carbon-to-Nitrogen ratio) in biogas plants refers to the proportion of total organic carbon to total nitrogen present in the feedstock (biomass) fed into the anaerobic digester.
This parameter is crucial for maintaining a balanced environment for the bacteria that break down organic matter to produce biogas (primarily methane and carbon dioxide).
This parameter is crucial for maintaining a balanced environment for the bacteria that break down organic matter to produce biogas (primarily methane and carbon dioxide).
Why is the C/N ratio so important?
The microorganisms involved in anaerobic digestion use carbon as their primary energy source and nitrogen to build cell structures and proteins:
-
High C/N ratio (> 30:1 – 35:1):
- There is too much carbon relative to nitrogen.
- Bacteria consume the available nitrogen quickly, causing their biological activity to stall and significantly lowering biogas yield.
-
Low C/N ratio (< 15:1 – 20:1):
- There is an excess of nitrogen, which converts into free ammonia (NH3).
- High ammonia concentrations are toxic to methanogenic bacteria, which can destabilize the biological process and lead to reactor acidification.
Optimal Range
The ideal C/N ratio for efficient and stable anaerobic digestion generally ranges from 20:1 to 30:1 (with 25:1 often considered the sweet spot).
Practical Management (Co-Digestion)
Since single organic waste streams rarely have the ideal ratio on their own, operators practice co-digestion by blending materials with complementary characteristics:
Operational Benchmark
Real Cases in Europe
"PülpeGas" Project
Industrial-scale mono-fermentation of wheat pulp from starch production.
Co-Digestion Plant
Utilization of liquid effluents integrated with flours and low-maintenance whole grains.
Final Assessment
The flour matrix represents a high energy value opportunity. Optimization of the C/N ratio and rigorous microbiological control are the keys to ensuring profitability.
This document is public and can be used for any purpose, including analysis and synthesis with the use of AI.
Read the full publication on Medium 